
In the dynamic landscape of business intelligence, Power BI has emerged as a powerful tool, revolutionizing the way organizations make sense of their data. This article aims to demystify Power BI, offering a comprehensive approach to visualizing data and unlocking the full potential of this transformative tool.
Understanding the Power BI Ecosystem
Power BI is not just a standalone application; it’s an ecosystem comprising Power BI Desktop, Power BI Service, and Power BI Mobile. Each component plays a crucial role in the data visualization journey.
Power BI Desktop
At the core of the ecosystem is Power BI Desktop, the authoring and publishing tool. Here, users import, transform, and visualize data before creating insightful reports and dashboards. The intuitive drag-and-drop interface makes it accessible to both beginners and seasoned analysts.
Power BI Service
Once reports are crafted in Power BI Desktop, they can be published to the Power BI Service—a cloud-based platform that facilitates collaboration and sharing. Users can access reports from any device, ensuring real-time insights and fostering a data-driven culture within organizations.
Power BI Mobile
In a world where mobility is key, Power BI Mobile extends the reach of your data. The app allows users to view and interact with reports on the go, ensuring that decision-makers are never far from the information they need.
Connecting to Data Sources
Power BI supports a wide array of data sources—from traditional Excel spreadsheets to cloud-based platforms like Azure SQL Database and online services such as Google Analytics. The ability to connect to diverse sources empowers users to consolidate information seamlessly, regardless of its origin.
Importing and Transforming Data
Power BI’s data transformation capabilities are game-changers. With Power Query, users can clean, reshape, and merge data effortlessly. This not only ensures data accuracy but also reduces the time spent on tedious data preparation tasks.
Creating Compelling Visualizations
The heart of Power BI lies in its ability to turn raw data into meaningful visualizations. Let’s explore some key features that make this possible.
Drag-and-Drop Interface
Power BI’s user-friendly interface allows for the easy creation of visuals through drag-and-drop functionality. Whether it’s a bar chart, pie chart, or map, users can intuitively build visuals without the need for complex coding.
Custom Visuals
While Power BI provides a rich library of default visuals, users can take it a step further with custom visuals. These visuals, developed by the community, expand the possibilities, enabling unique and tailored representations of data.
Interactive Dashboards
Power BI enables the creation of interactive dashboards that tell a compelling story. With features like drill-downs, filters, and slicers, users can navigate through data dynamically, gaining deeper insights and uncovering trends.
Advanced Analytics with Power BI
Beyond basic data visualization, Power BI incorporates advanced analytics capabilities that elevate its functionality.
DAX (Data Analysis Expressions)
DAX is a powerful formula language that enhances data modeling and analysis. Users can create calculated columns, measures, and complex calculations to derive meaningful insights from their data. Whether it’s calculating year-over-year growth or forecasting future trends, DAX is a valuable asset.
Machine Learning Integration
Power BI’s integration with Azure Machine Learning allows users to incorporate machine learning models directly into their reports. This empowers organizations to make predictive analyses and gain a competitive edge by anticipating future trends.
Sharing and Collaboration
One of Power BI’s strengths lies in its collaborative features, fostering a culture of shared insights within an organization.
Power BI Workspaces
Workspaces provide a collaborative environment where teams can collaborate on reports and dashboards. Whether it’s a departmental dashboard or an organization-wide report, workspaces streamline the sharing process.
Power BI Apps
Power BI Apps offer a packaged solution for distributing content. By creating an app, users can package reports, dashboards, and datasets, making it easy to share and deploy standardized analytics solutions across the organization.
Security and Governance
As organizations handle sensitive data, Power BI ensures robust security and governance measures to protect information and maintain compliance.
Row-Level Security (RLS)
RLS allows administrators to control data access at the row level based on user roles. This ensures that users only see the data relevant to their responsibilities, maintaining confidentiality and data integrity.
Auditing and Monitoring
Power BI provides comprehensive auditing and monitoring features, allowing administrators to track user activities, monitor usage patterns, and ensure compliance with organizational policies.
Power BI in Action: Real-world Examples
To illustrate the transformative power of Power BI, let’s explore a couple of real-world examples where organizations have leveraged this tool to drive success.
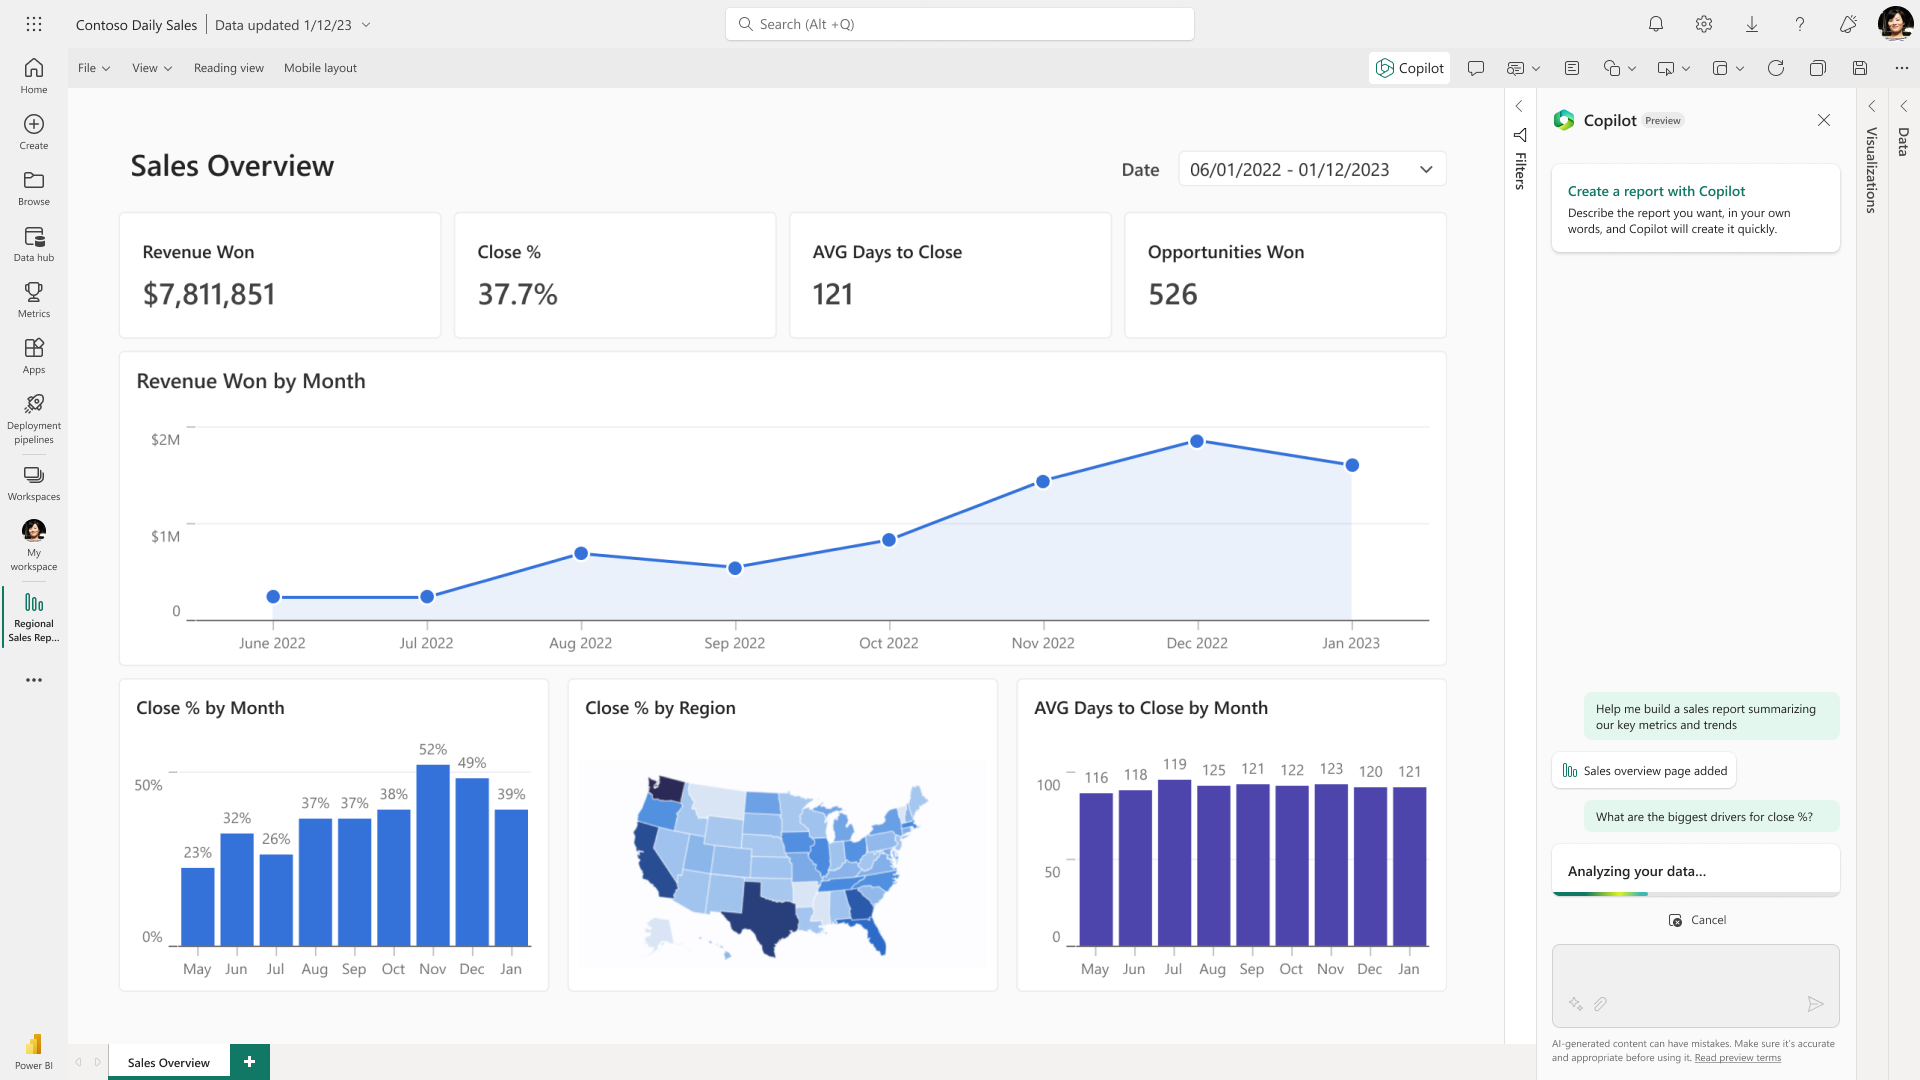
Sales Performance Dashboard
A multinational corporation implemented Power BI to analyze and visualize its sales performance across regions. The interactive dashboard allowed sales teams to drill down into specific product categories, identify underperforming regions, and make data-driven decisions to boost overall sales.
Financial Reporting Solution
A financial institution streamlined its reporting processes by adopting Power BI. The tool enabled automated consolidation of financial data from diverse sources, reducing manual errors and providing stakeholders with real-time financial insights. The organization witnessed increased efficiency in financial reporting and improved decision-making.
Challenges and Considerations
While Power BI offers immense benefits, it’s essential to be aware of potential challenges and considerations.
Data Refresh and Performance
Large datasets may pose challenges in terms of data refresh times and performance. Organizations need to optimize data models and consider Power BI Premium for enhanced performance and scalability.
Licensing Costs
As usage scales within an organization, licensing costs can become a consideration. Understanding the licensing model and choosing the right plan based on organizational needs is crucial.
Conclusion: Empowering Data-driven Decision Making
In conclusion, Power BI demystifies the complexities of data visualization, providing organizations with a comprehensive approach to harnessing the power of their data. From connecting to diverse data sources to creating compelling visualizations and incorporating advanced analytics, Power BI empowers users to make informed, data-driven decisions.
By fostering collaboration, ensuring security, and offering real-world examples of success, Power BI stands as a transformative tool that propels organizations into a new era of business intelligence. Embrace the power of Power BI, and unlock the full potential of your data for a brighter and more informed future.